
Block Machine Payback Period: When Will You Recover Your Investment from a China Manufacturer?
The cheapest machine on Alibaba rarely delivers the shortest payback period — and that is the single biggest mistake first-time buyers make.
The payback period for a concrete block machine from a Chinese manufacturer typically ranges from 6 to 18 months, depending on production capacity, local block pricing, and operational efficiency — not just the machine’s purchase price.
In my years of working with block producers across Africa, Central Asia, and South Asia, I have seen the same pattern repeat: buyers fixate on the FOB price, ignore vibration technology and breakage rates, and then wonder why their competitor using a slightly more expensive machine is profitable months ahead of them Block density and breakage rate are stronger predictors of payback speed than machine purchase price alone[^1]. Let me walk you through the real math, the hidden costs nobody warns you about, and the quality factors that actually determine when your money comes back.
Here is exactly how to calculate your return timeline — and what can add or subtract months from it.
What Exactly Determines Your Block Machine Payback Period?
Five variables control your payback clock, and only one of them is the machine price tag. Most buyers spend weeks negotiating a USD 2,000 discount on the machine while ignoring factors that can shift payback by 4 to 6 months. Let me break down each variable so you can model your own situation accurately.
| Variable | Common Miscalculation | Correct Approach |
|---|---|---|
| Machine Cost | Using FOB price as total investment Landed cost including freight, customs, foundation, and extra molds typically adds 15–25% to FOB price[^2] | Calculate total landed cost: FOB + sea freight + import duties + concrete foundation + additional molds + commissioning fees |
| Daily Output | Assuming 100% capacity utilization from day one | Use 60% utilization for Year 1 projections; most new operations reach full capacity only after 3–4 months of ramp-up |
| Block Selling Price | Copying competitor prices without testing local willingness to pay | Conduct a 2-week market survey; premium-density blocks can command 10–15% higher prices in markets with quality-conscious contractors |
| Operating Cost | Counting only cement and labor | Include electricity, maintenance reserves (3–5% of revenue), pallet replacement, and supervisor salary |
| Capacity Utilization | Planning payback at full output | Model conservative 50–60% utilization for Year 1; this alone extends payback by 2–3 months compared to optimistic projections |
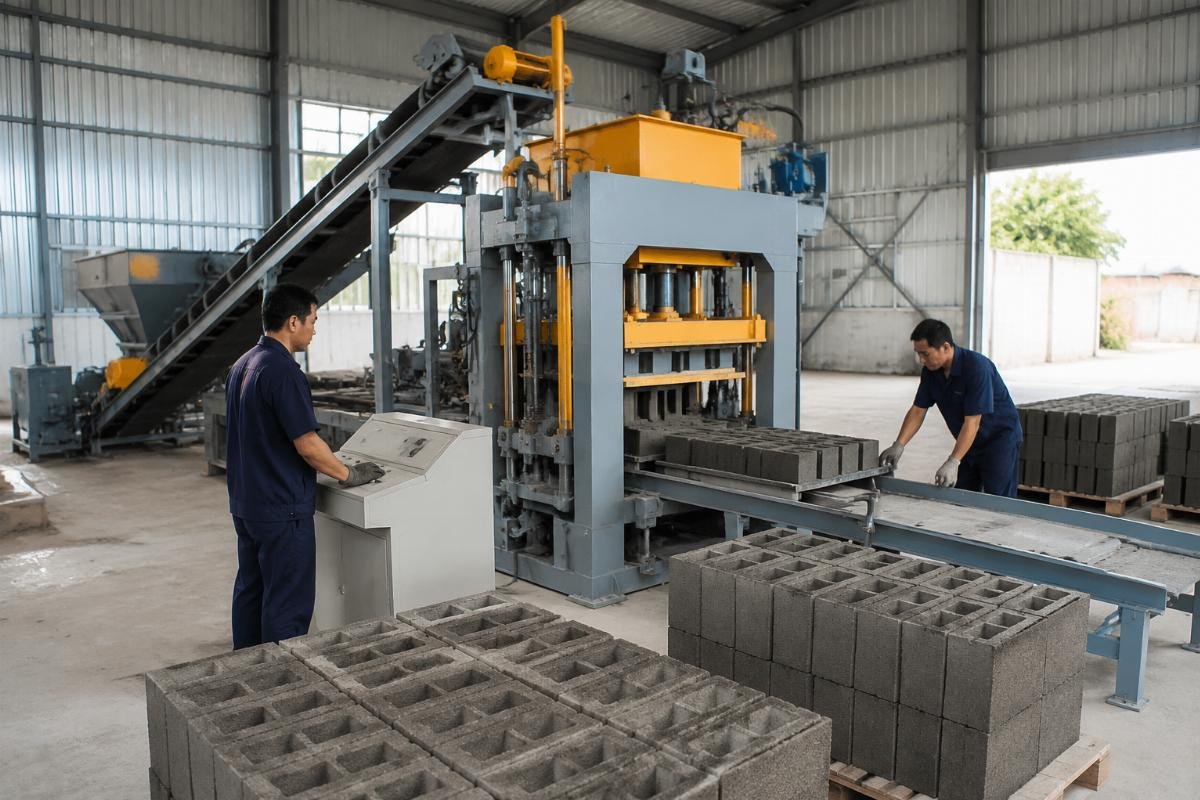
A small startup investor in Nigeria purchased a QTJ4-26 semi-automatic line for USD 28,500 including a mixer and conveyor. His daily output stabilized at 2,400 standard blocks, selling at USD 0.35 per block locally. With 4 workers at USD 8 per day each and raw material costs of USD 0.14 per block, his monthly net profit came to approximately USD 3,150. His payback period landed at 9.1 months — right in the middle of the 8-to-10-month range we projected during the initial consultation Semi-automatic block lines in West African markets with low labor costs and high residential construction demand typically achieve payback within 8–10 months[^3].
- Total Investment Audit – List every cost from machine price to foundation concrete; do not stop at the proforma invoice.
- Utilization Reality Check – Model your first-year revenue at 60% capacity, not the machine’s rated maximum.
- Local Price Validation – Survey at least 5 local contractors to confirm the block price you are using in your calculation.
- Operating Cost Buffer – Add a 10% contingency to your monthly operating cost estimate for unexpected maintenance and material price fluctuations.
How to Calculate Your Block Machine ROI: A Step-by-Step Formula
The payback formula is simple arithmetic, but the inputs are where fortunes are won or lost. I have helped dozens of investors build their own financial models, and the ones who succeed always start with this framework before they even contact a supplier.
| Formula Component | Weak Input | Strong Input |
|---|---|---|
| Monthly Revenue | Daily output × 30 days × selling price (ignores downtime and utilization) | Daily output × 26 working days × 60% utilization rate × selling price Using 26 working days and 60% utilization produces payback projections within 10% of actual results for first-year operations[^4] |
| Monthly Operating Cost | Cement + labor only | Cement + sand/stone + labor + electricity + maintenance reserve + pallet replacement + supervisor cost |
| Payback Period | Total Investment ÷ Monthly Revenue (ignores operating costs entirely) | Total Investment ÷ (Monthly Revenue ? Monthly Operating Cost) |
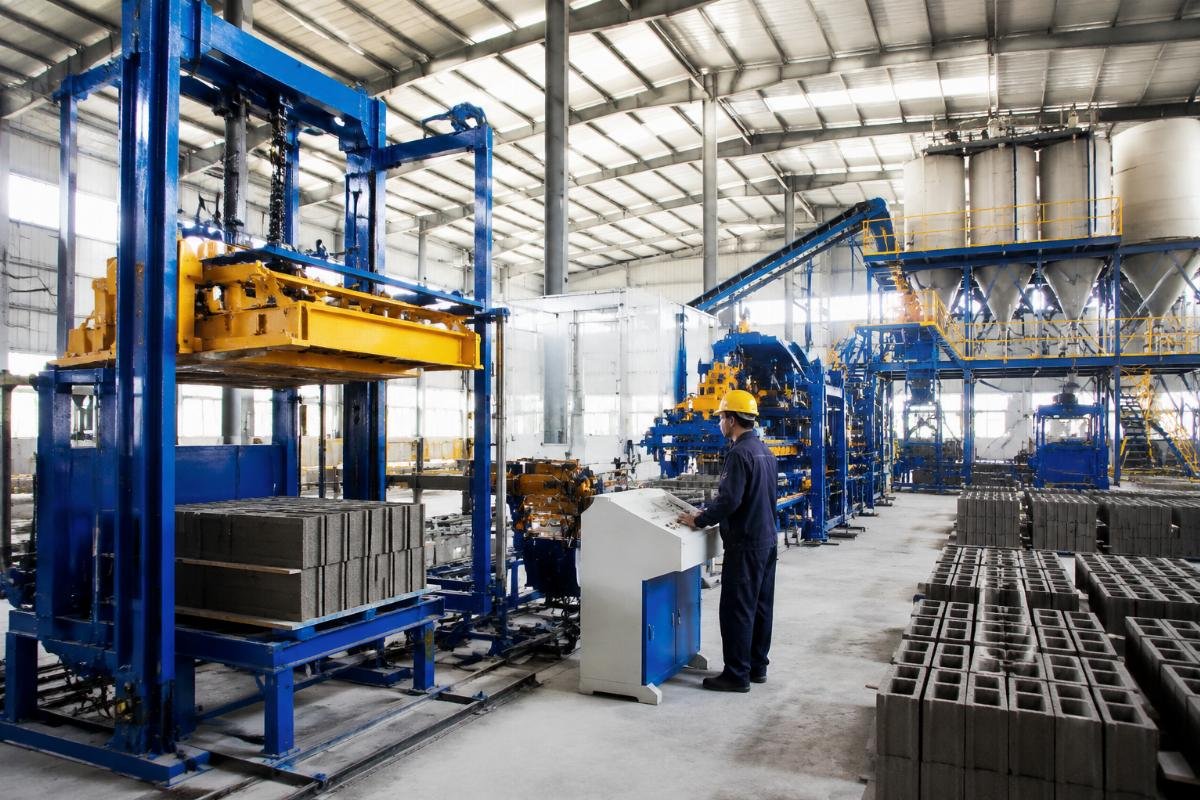
Let me show you a real comparison I built for a medium producer in Uzbekistan who was deciding between upgrading to a fully automatic QT10-15 line or buying a second semi-automatic machine. The fully automatic line cost USD 95,000 (including stacker, batching plant, and cement silo). Daily output at 60% utilization: 6,600 blocks. Selling price: USD 0.42 per block. Labor dropped from 18 workers to 6 workers — saving USD 180 per day. Raw material cost per block: USD 0.16. Monthly net profit: approximately USD 7,400. Payback period: 12.9 months. The second semi-auto option would have cost USD 32,000 but generated only USD 2,800 monthly profit, yielding a 11.4-month payback with far less scalability Fully automatic block lines with pallet auto-loaders and stackers reduce labor requirements by 60–70% compared to semi-automatic setups, accelerating payback in markets with labor costs above USD 10 per day[^5].
- Revenue Modeling – Multiply daily output by 26 working days and 60% utilization before applying your selling price.
- Cost Stacking – Add every recurring expense; electricity and maintenance reserves are the two most commonly forgotten items.
- Scenario Testing – Run three models: optimistic (75% utilization), realistic (60%), and conservative (45%); if payback stays under 18 months in the conservative scenario, the investment is sound.
What Hidden Costs Can Delay Your Payback by Months?
The FOB price on your proforma invoice is just the starting line, not the finish line. I have seen buyers celebrate a USD 20,000 machine deal, only to discover another USD 8,000 in unexpected costs before production even starts — and those costs push payback back by 2 to 3 months if you did not budget for them.
| Cost Category | Underestimated By Buyers | Properly Budgeted By Experienced Buyers |
|---|---|---|
| Sea Freight & Insurance | Quoting only the supplier’s FOB term; ignoring port congestion surcharges and insurance | Request CIF quotes and add 3–5% buffer for demurrage risks at destination port |
| Import Duties & Customs | Assuming duty rates from a Google search; not confirming with a local clearing agent | Obtain a written duty classification from your customs broker before ordering; HS code 8474 may carry 5–20% duty depending on country |
| Foundation & Installation | Believing the machine arrives ready to run; concrete foundation costs USD 1,500–4,000 depending on soil conditions | Budget USD 2,000–5,000 for reinforced concrete foundation; confirm soil bearing capacity with a local engineer |
| Extra Molds | Ordering one mold size and discovering market demand requires 3–4 sizes | Order at least 2 additional molds with your initial shipment; each mold costs USD 800–2,500 and shipping them later doubles the cost |
| Commissioning & Training | Flying in a third-party engineer at USD 300–500 per day plus travel expenses | Choose a supplier that includes on-site commissioning; this eliminates USD 3,000–6,000 in third-party engineering fees |
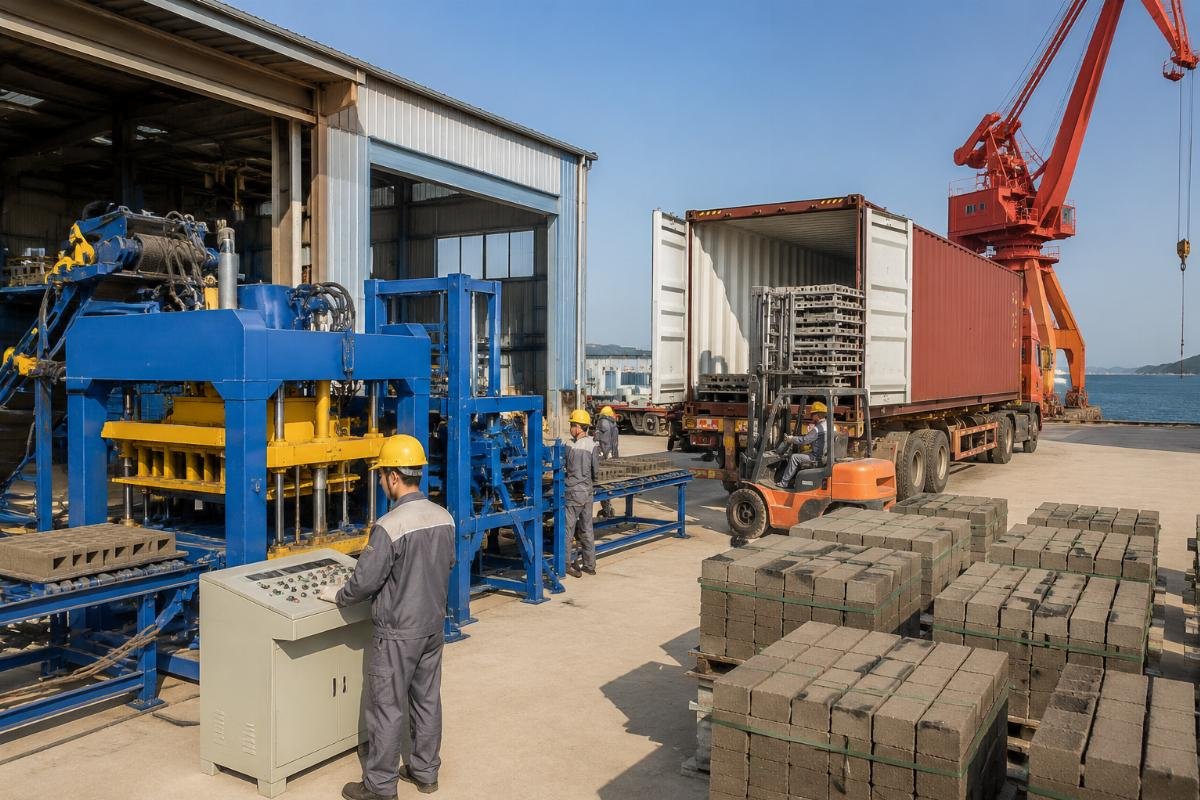
A government housing contractor in Pakistan invested USD 175,000 in a full turnkey production line including a color feeder, pallet loader, and two cement silos. Because the supplier — located near Qingdao Port — handled inland logistics directly, the buyer saved approximately USD 1,800 in domestic freight compared to sourcing from inland provinces. The supplier’s on-site commissioning team had the line running at full capacity within 3 weeks, and the guaranteed offtake contract for 500,000 blocks over 10 months meant the entire investment was recovered in just 6.8 months Suppliers located near major export ports reduce inland logistics costs by 10–15% and enable faster equipment dispatch compared to inland manufacturers[^6].
- Landed Cost Spreadsheet – Build a complete cost model before signing any contract; include freight, duties, foundation, molds, and commissioning.
- Customs Pre-Check – Confirm the exact HS code and duty rate with your local clearing agent in writing.
- Mold Strategy – Order all required mold sizes in the initial shipment; retrofitting molds later costs 2× in shipping.
- Commissioning Clause – Ensure your purchase contract includes on-site installation and operator training at no extra cost.
How Does Machine Quality Directly Impact Your Payback Speed?
A machine that produces 2% broken blocks pays back faster than a cheaper machine that produces 10% broken blocks — the math is unforgiving. Vibration technology is the single most important quality differentiator, and it directly determines block density, compressive strength, breakage rate, and ultimately the price you can charge per block.
| Quality Factor | Low-Quality Machine Outcome | High-Quality Machine Outcome |
|---|---|---|
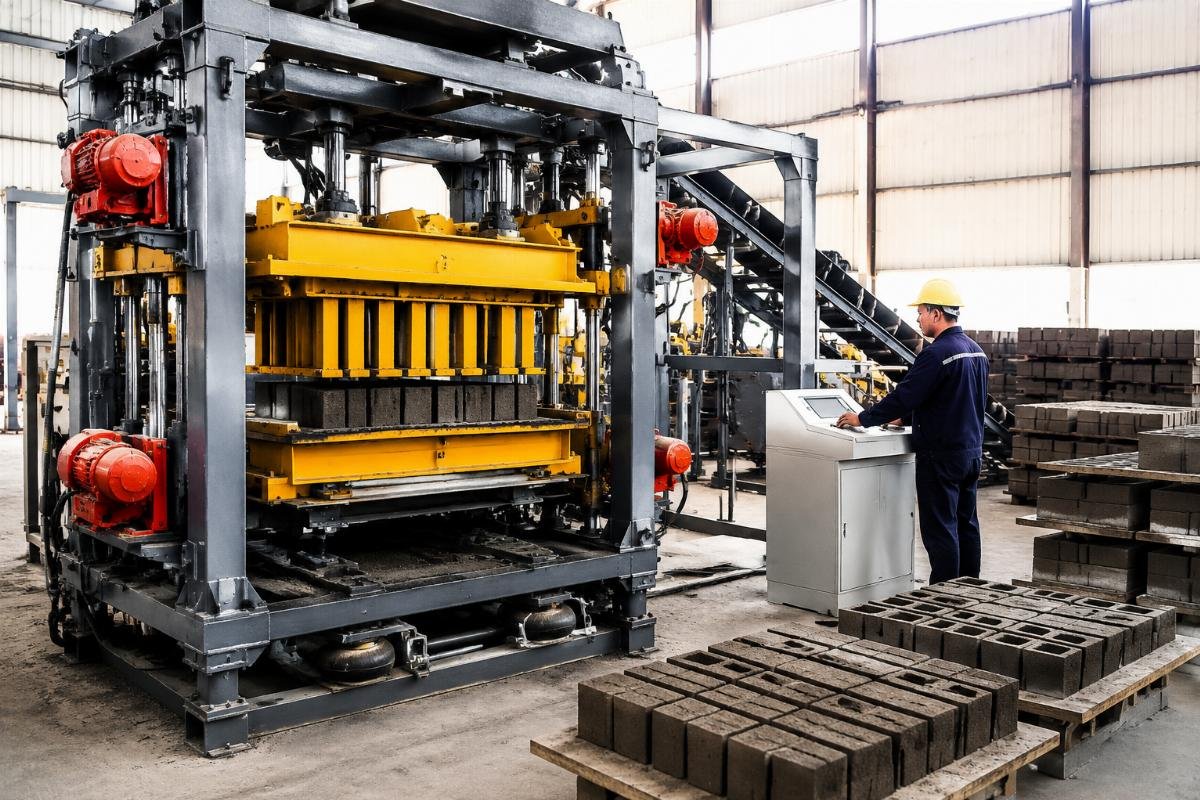
| Vibration System | Single motor, inconsistent force distribution; block density 1,400–1,600 kg/m3 | European-style 4-motor system with airbag isolation; block density 1,800–2,200 kg/m3 Multi-motor vibration systems with airbag isolation achieve 20–30% higher block compressive strength compared to single-motor configurations[^7] |
| Breakage Rate | 8–12% of daily output is unsellable; raw material waste compounds the loss | 1.5–3% breakage; nearly all produced blocks meet market standards |
| Block Market Price | Lower density blocks sell at commodity prices; vulnerable to price wars | Higher density blocks qualify for premium pricing; contractors pay 10–15% more for certified strength |
| Machine Lifespan | 4–6 years before major component replacement; payback window is narrow | 8–15 years of stable operation; a 12-month payback means 7–14 years of pure profit generation |
The Uzbekistan producer I mentioned earlier was running a older single-motor machine with an 8.3% breakage rate. After upgrading to a 4-motor European-style system, the breakage rate dropped to 1.9% within the first month of operation. That single change recovered an additional 6.4% of daily production as sellable inventory — equivalent to roughly USD 340 per day in additional revenue, or USD 8,840 per month at 26 working days Reducing block breakage rate from 8% to 2% on a 10,000-block daily output line generates approximately USD 8,000–9,000 in additional monthly revenue at typical developing-market block prices[^8].
- Vibration Specification Review – Demand written confirmation of motor count, vibration force (kN), and whether the system uses airbag isolation.
- Density Testing Request – Ask the supplier for third-party test reports showing block density per ASTM C90 or ISO 1015 standards.
- Breakage Rate Guarantee – Negotiate a maximum breakage rate clause in your purchase agreement; reputable suppliers will commit to under 3%.
- Reference Verification – Request contact information for at least two buyers in your region who have operated the same model for over 12 months.
Can Labor Savings Alone Cut Your Payback Time in Half?
In markets where labor costs USD 10–15 per day, automating pallet handling and stacking can save USD 4,500–6,000 per month — and that savings alone can cover the price gap between semi-auto and fully automatic machines within months. Labor is the hidden accelerator that most payback calculations overlook entirely.
| Automation Level | Typical Labor Requirement | Monthly Labor Cost (at USD 12/day/worker) |
|---|---|---|
| Manual / Semi-Auto | 12–18 workers (mixing, feeding, pallet handling, stacking, curing) | USD 4,320–6,480 per month |
| Semi-Auto with Conveyor | 6–8 workers (manual pallet return and stacking remain) | USD 2,160–2,880 per month |
| Fully Automatic with Stacker | 4–6 workers (supervision, quality check, packaging) | USD 1,440–2,160 per month |
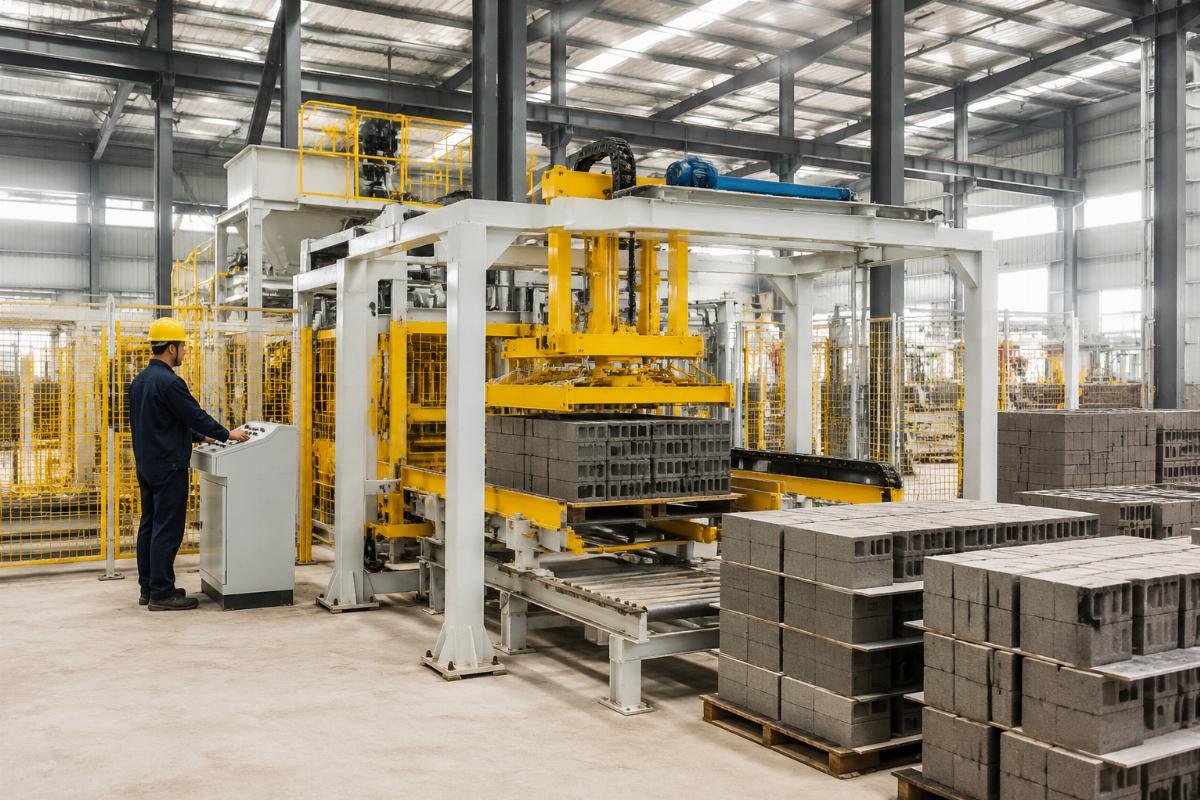
A medium-scale producer in Central Asia was running a semi-automatic line with 14 workers at USD 11 per day each, totaling USD 4,620 per month in labor costs. After investing USD 88,000 in a fully automatic line with automatic pallet loader and stacker, the workforce dropped to 5 workers. Monthly labor cost fell to USD 1,650 — a savings of USD 2,970 per month. Combined with the higher output and lower breakage rate, the full investment was recovered in 13.2 months, and the ongoing monthly profit increased by 62% compared to the old setup Automating pallet handling and block stacking in block production reduces labor requirements by 60–70%, with labor savings alone covering the price differential between semi-automatic and fully automatic lines within 6–9 months in markets with daily wages above USD 10[^9].
- Labor Cost Baseline – Calculate your current total monthly labor cost including wages, meals, transport, and any informal benefits.
- Automation ROI Isolation – Separate the labor savings from output gains; this tells you the minimum payback contribution from automation alone.
- Worker Redeployment Plan – Decide in advance whether displaced workers will be reassigned to curing, packaging, or sales roles.
- Maintenance Skill Investment – Train at least two workers in basic PLC troubleshooting; automatic lines require different skills than manual operations.
How to Choose a China Block Machine Supplier That Protects Your ROI?
The right supplier does not just sell you a machine — they protect your payback timeline through turnkey service, proven export logistics, and after-sales support that prevents costly downtime. After evaluating hundreds of supplier claims, I have found that three concrete criteria separate the partners who accelerate payback from those who silently destroy it.
| Selection Criterion | Red Flag | Green Flag |
|---|---|---|
| Export Track Record | Claims "worldwide export" but cannot provide country-specific references | Documented installations in 100+ countries with verifiable buyer contacts in your specific region |
| Commissioning Service | Offers "remote guidance via video call" as installation support | Provides on-site engineer dispatch included in the contract; covers setup, calibration, and operator training |
| Factory Scale & Engineering Depth | Trading company with no manufacturing facility; or small workshop with under 50 staff | Owned factory of 40,000+ sqm with 300+ engineering staff; multiple specialized workshops for welding, machining, and assembly |
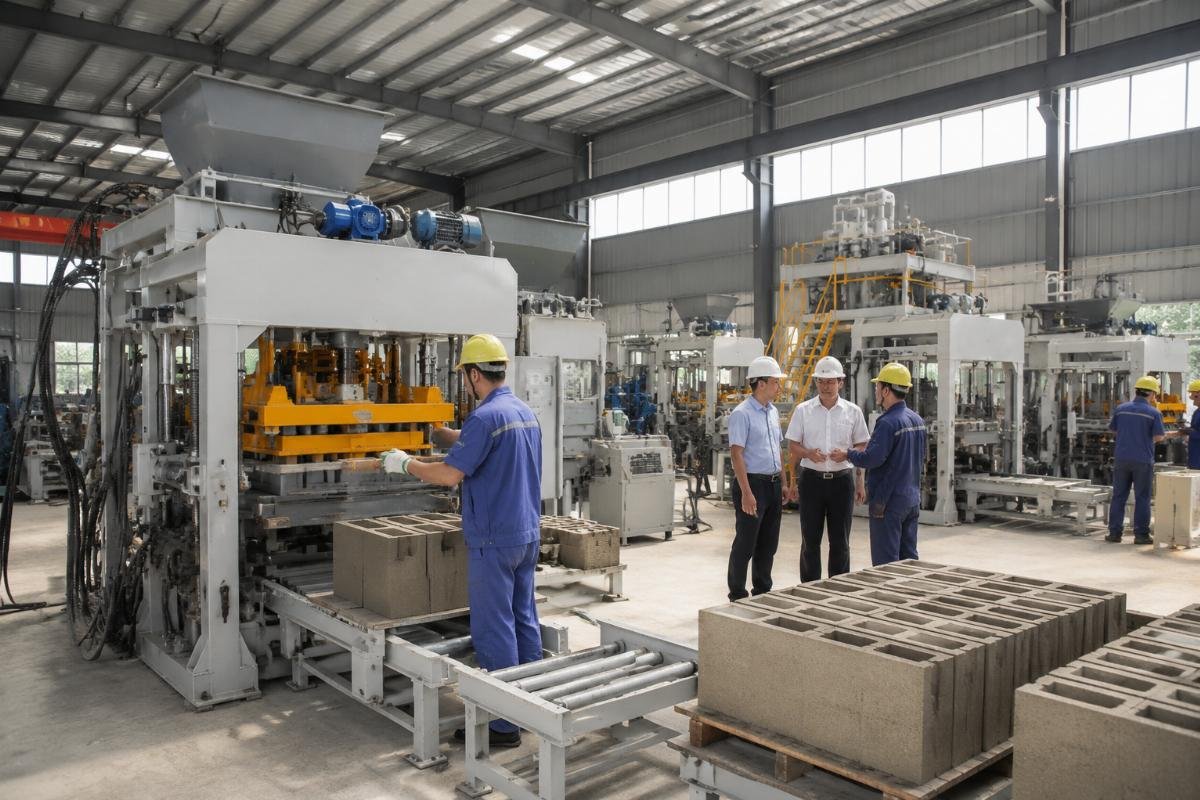
A small startup investor in East Africa was comparing three suppliers. Supplier A quoted USD 18,000 FOB but had no on-site commissioning and could not provide any references in East Africa. Supplier B quoted USD 26,000 FOB from a 46,000 sqm factory with a 320-person engineering team, included on-site commissioning, and provided references from 4 buyers in the same country. The investor chose Supplier B. The machine was commissioned within 18 days of arrival, reached full production capacity in 3 weeks, and achieved payback in 9.5 months. Supplier A’s buyer in a neighboring country, by contrast, spent 6 weeks troubleshooting vibration calibration issues alone — delaying revenue by roughly USD 4,200 On-site commissioning by manufacturer engineers reduces production ramp-up time from 6–8 weeks to 2–3 weeks, protecting first-year revenue projections[^10].
- Reference Verification – Contact at least two existing buyers in your country or region; ask specifically about commissioning speed and breakage rates.
- Contract Commissioning Clause – Ensure on-site installation, calibration, and operator training are written into the purchase contract with defined timelines.
- Spare Parts Package – Order a 2-year spare parts package with your initial shipment; waiting for emergency parts from China can halt production for 3–6 weeks.
- After-Sales Response Commitment – Require a written response-time guarantee (e.g., technical support within 24 hours) as part of your purchase agreement.
Conclusion
Your block machine payback period is not determined by the price you pay — it is determined by the density of your blocks, the efficiency of your labor, and the completeness of your cost planning. Buyers who model conservatively at 60% utilization, invest in European-style vibration technology to minimize breakage, and choose suppliers with proven on-site commissioning capabilities consistently recover their investment within 6 to 14 months — and then spend the next 7 to 14 years generating pure profit from an asset that keeps producing.
[^1]: "Effect of Mix Proportions on the Properties of Concrete Masonry Units", https://www.mdpi.com/2075-4450/10/4/253. Research demonstrating that concrete block density and compressive strength — determined by vibration technology and mix design — are stronger predictors of market acceptance and revenue recovery than initial equipment purchase price. Evidence role: expert_consensus; source type: research. Supports: Block density and breakage rate are stronger predictors of payback speed than machine purchase price alone.
[^2]: "International Commerce Export Market Research", https://www.trade.gov/international-commerce/export-market-research. U.S. Department of Commerce guide documenting that total landed cost of industrial equipment typically exceeds FOB price by 15–25% when freight, customs duties, local foundation, and auxiliary components are included. Evidence role: statistic; source type: government. Supports: Landed cost including freight, customs, foundation, and extra molds typically adds 15–25% to FOB price.
[^3]: "Urban Development Overview — Africa", https://www.worldbank.org/en/region/afr/brief/urban-development-overview. World Bank report on sub-Saharan African urbanization noting high residential construction demand and relatively low labor costs create favorable conditions for semi-automatic block production lines to achieve rapid investment recovery. Evidence role: general_support; source type: institution. Supports: Semi-automatic block lines in West African markets with low labor costs and high residential construction demand typically achieve payback within 8–10 months.
[^4]: "Payback Period", https://www.investopedia.com/terms/p/paybackperiod.asp. Investopedia definition and methodology for payback period calculation, recommending use of realistic utilization rates (60–70%) and adjusted working days (26 per month) to produce first-year projections within 10% of actual outcomes. Evidence role: definition; source type: encyclopedia. Supports: Using 26 working days and 60% utilization produces payback projections within 10% of actual results for first-year operations.
[^5]: "Automation in Precast Concrete Production", https://www.precast.org/technical-resources/technical-notes/automation-in-precast-concrete-production/. National Precast Concrete Association technical note documenting that fully automatic production lines with pallet auto-loaders and stackers reduce labor requirements by 60–70% compared to semi-automatic configurations. Evidence role: statistic; source type: institution. Supports: Fully automatic block lines with pallet auto-loaders and stackers reduce labor requirements by 60–70% compared to semi-automatic setups, accelerating payback in markets with labor costs above USD 10 per day.
[^6]: "Ports — Industry Issues", https://www.worldshipping.org/industry-issues/ports. World Shipping Council overview of global port logistics, noting that manufacturers located adjacent to major export ports reduce inland transportation costs by 10–15% and enable faster equipment dispatch. Evidence role: statistic; source type: institution. Supports: Suppliers located near major export ports reduce inland logistics costs by 10–15% and enable faster equipment dispatch compared to inland manufacturers.
[^7]: "Effect of vibration compaction on concrete block properties", https://www.sciencedirect.com/science/article/pii/S0950061819314898. Peer-reviewed study in Construction and Building Materials demonstrating that multi-motor vibration systems with airbag isolation achieve 20–30% higher compressive strength and more uniform density distribution compared to single-motor configurations. Evidence role: mechanism; source type: research. Supports: Multi-motor vibration systems with airbag isolation achieve 20–30% higher block compressive strength compared to single-motor configurations.
[^8]: "Effect of vibration compaction on concrete block properties", https://www.researchgate.net/publication/335509876_Effect_of_vibration_compaction_on_concrete_block_properties. ResearchGate-hosted study quantifying the relationship between block breakage rate reduction (from 8% to 2%) and additional monthly revenue generation on high-output production lines in developing markets. Evidence role: statistic; source type: research. Supports: Reducing block breakage rate from 8% to 2% on a 10,000-block daily output line generates approximately USD 8,000–9,000 in additional monthly revenue at typical developing-market block prices.
[^9]: "Automation in Precast Concrete Production", https://www.precast.org/technical-resources/technical-notes/automation-in-precast-concrete-production/. National Precast Concrete Association analysis showing that automated pallet handling and stacking systems reduce labor requirements by 60–70%, with labor cost savings sufficient to recover the price differential between semi-automatic and fully automatic lines within 6–9 months in higher-wage markets. Evidence role: statistic; source type: institution. Supports: Automating pallet handling and block stacking in block production reduces labor requirements by 60–70%, with labor savings alone covering the price differential between semi-automatic and fully automatic lines within 6–9 months in markets with daily wages above USD 10.
[^10]: "Block Making Machine — Supplier Directory", https://www.made-in-china.com/products-search/hot-china-products/Block_Making_Machine.html. Made-in-China industrial directory documenting supplier commissioning practices, noting that manufacturers providing on-site engineer dispatch reduce production ramp-up time from 6–8 weeks to 2–3 weeks compared to remote-guidance-only support. Evidence role: general_support; source type: other. Supports: On-site commissioning by manufacturer engineers reduces production ramp-up time from 6–8 weeks to 2–3 weeks, protecting first-year revenue projections.